The verdict, both rulers
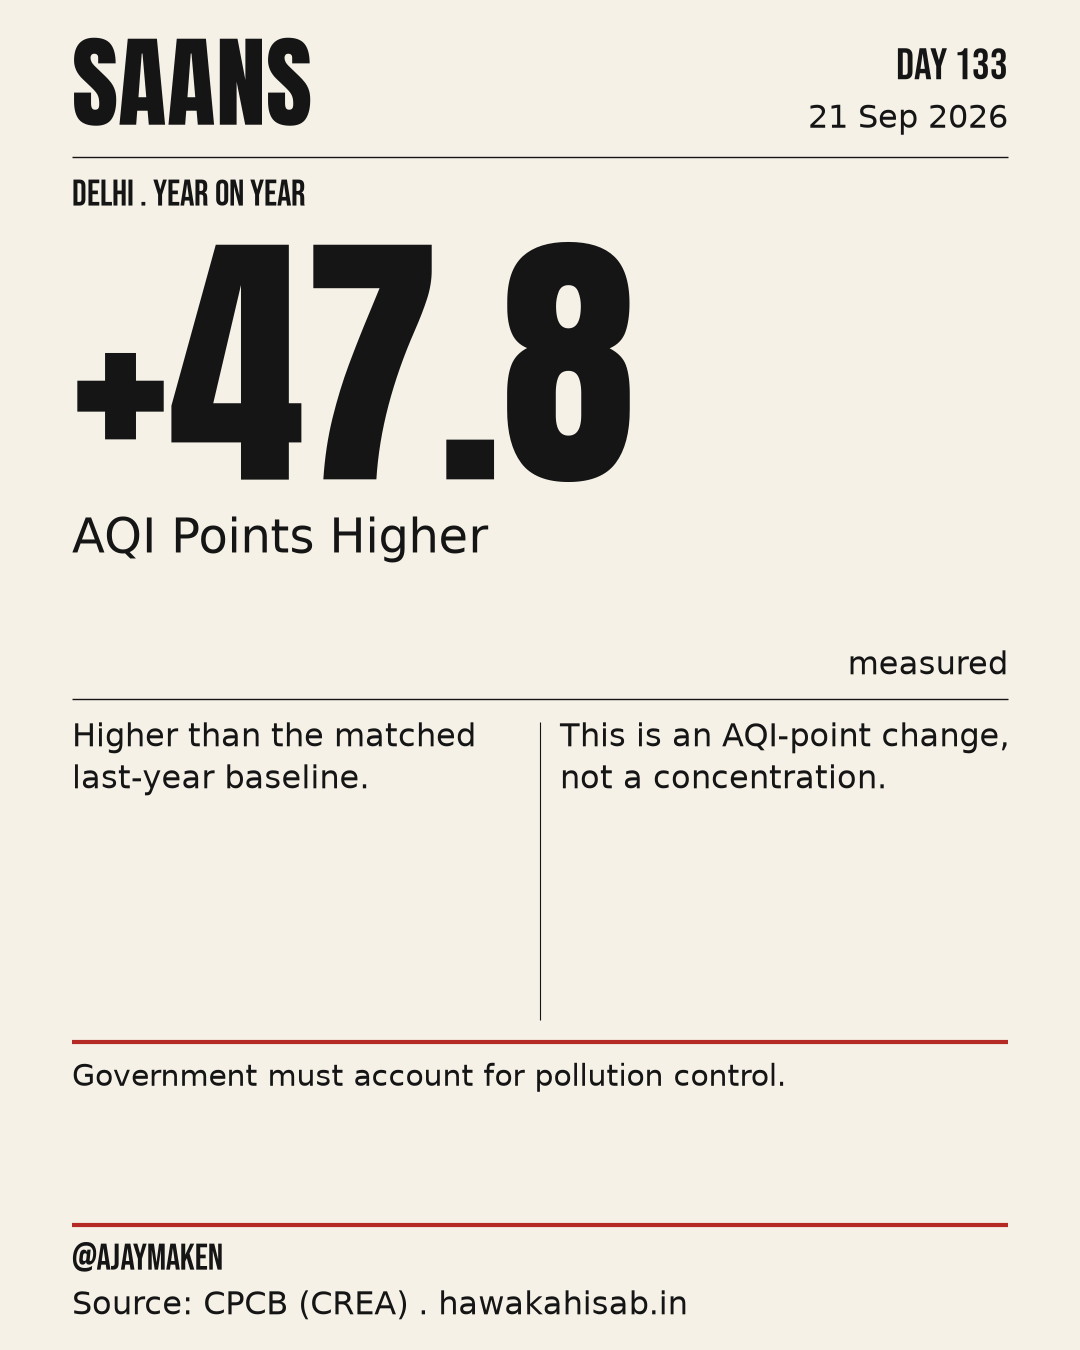
On its own count the pipeline puts the observed year at +45.9 points; with the weather removed it reads -7.4 on the model's count. 2 of 6 pollutants, SO2, CO, show no real improvement.
Against yesterday: the one-day move
From 160 to 169. The 95 per cent interval runs 0 to 14.9 points, on 43 matched stations, so the honest reading is level, not worse.
Against last year: the observed reading
Today 169 across 43 stations. The year is judged on the 36 matched stations: 172 today against 124, the mean of the same date ±7 days of 2025 at those stations. The interval runs 33.2 to 63.7 points.
The worst station in the city today
Poor, on PM2.5. Last year this station read 127 on the ±7-day mean around this date; the change is 128 points. Within 500 m of the monitor, 39% of the land is built up and 61% is under vegetation, so this reading describes a mixed neighbourhood.
The year, from its best days to its worst
On the same 263 dates the best tenth of days reads 77 against 72, and the worst tenth 292 against 288. Each is unchanged inside its margin, and the days at or below 200 went from 184 to 185.
How much of the city was above AQI 200
That is 11.6 of 43.1 reporting stations, against 27 per cent over the same dates last year, a change of +0.5 points on an interval of -2.7 to +3.7, so it is unchanged inside its margin.
Who the monitoring network reaches
Within 4 km live 88 per cent of Delhi's people, within 2 km 41 per cent, and within 500 m only 3.3 per cent. India's own rules ask for about 46 particulate monitors, because IS 5182 scales the count to population, and Delhi has 44. So the count test passes, while 29 of the 44 zones still stretch past 4 km, which is as far as a monitor is held to speak.
What each monitor's reading speaks for
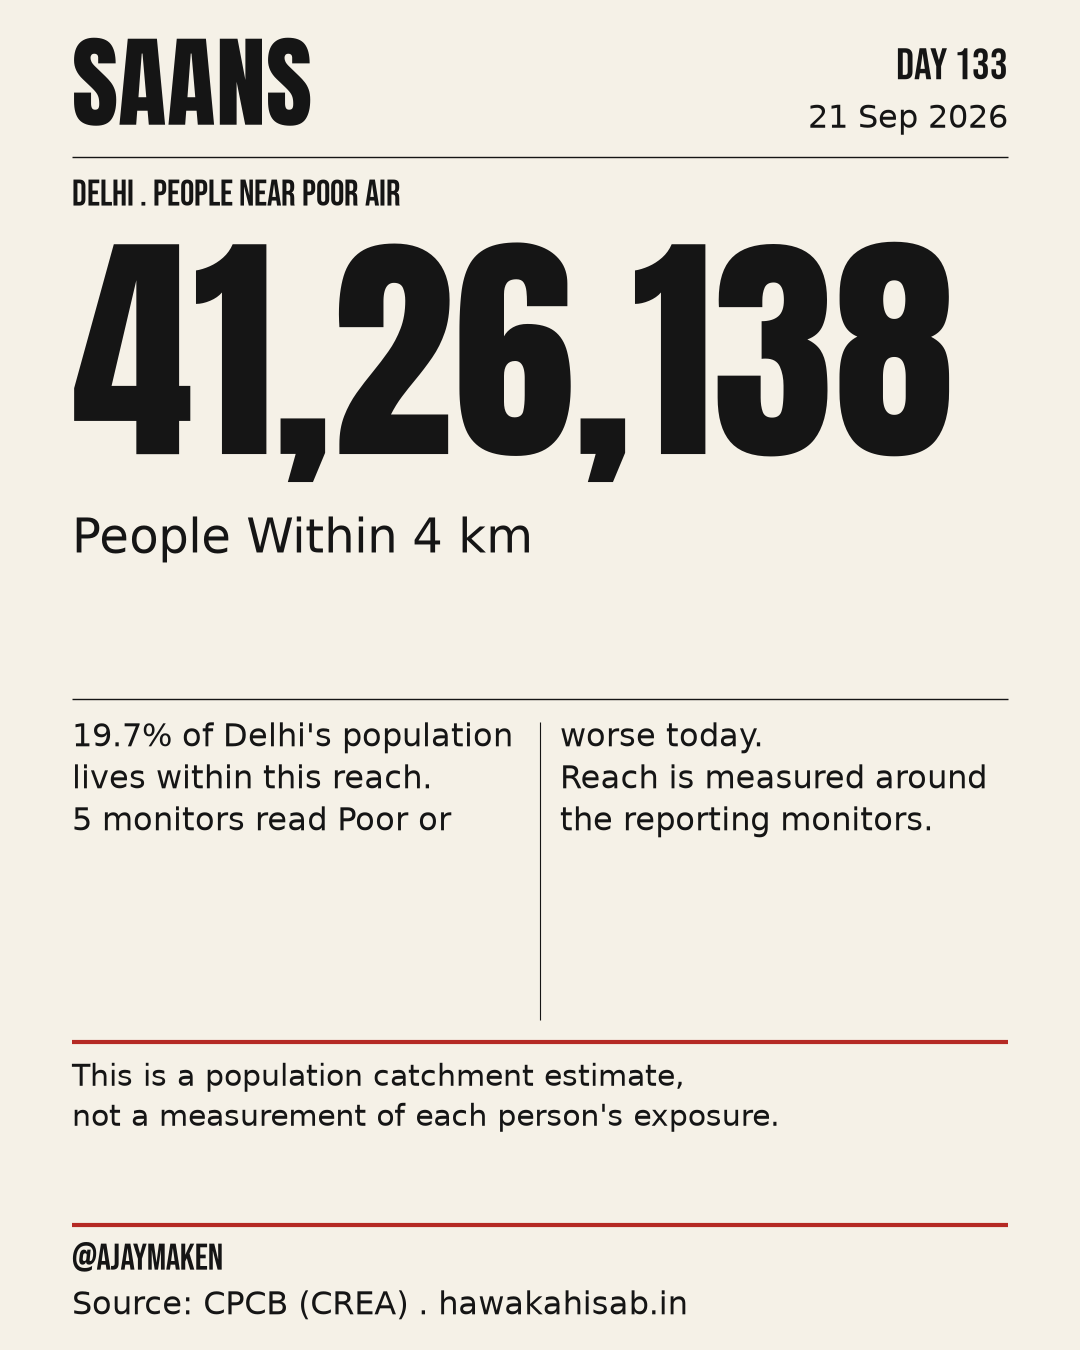
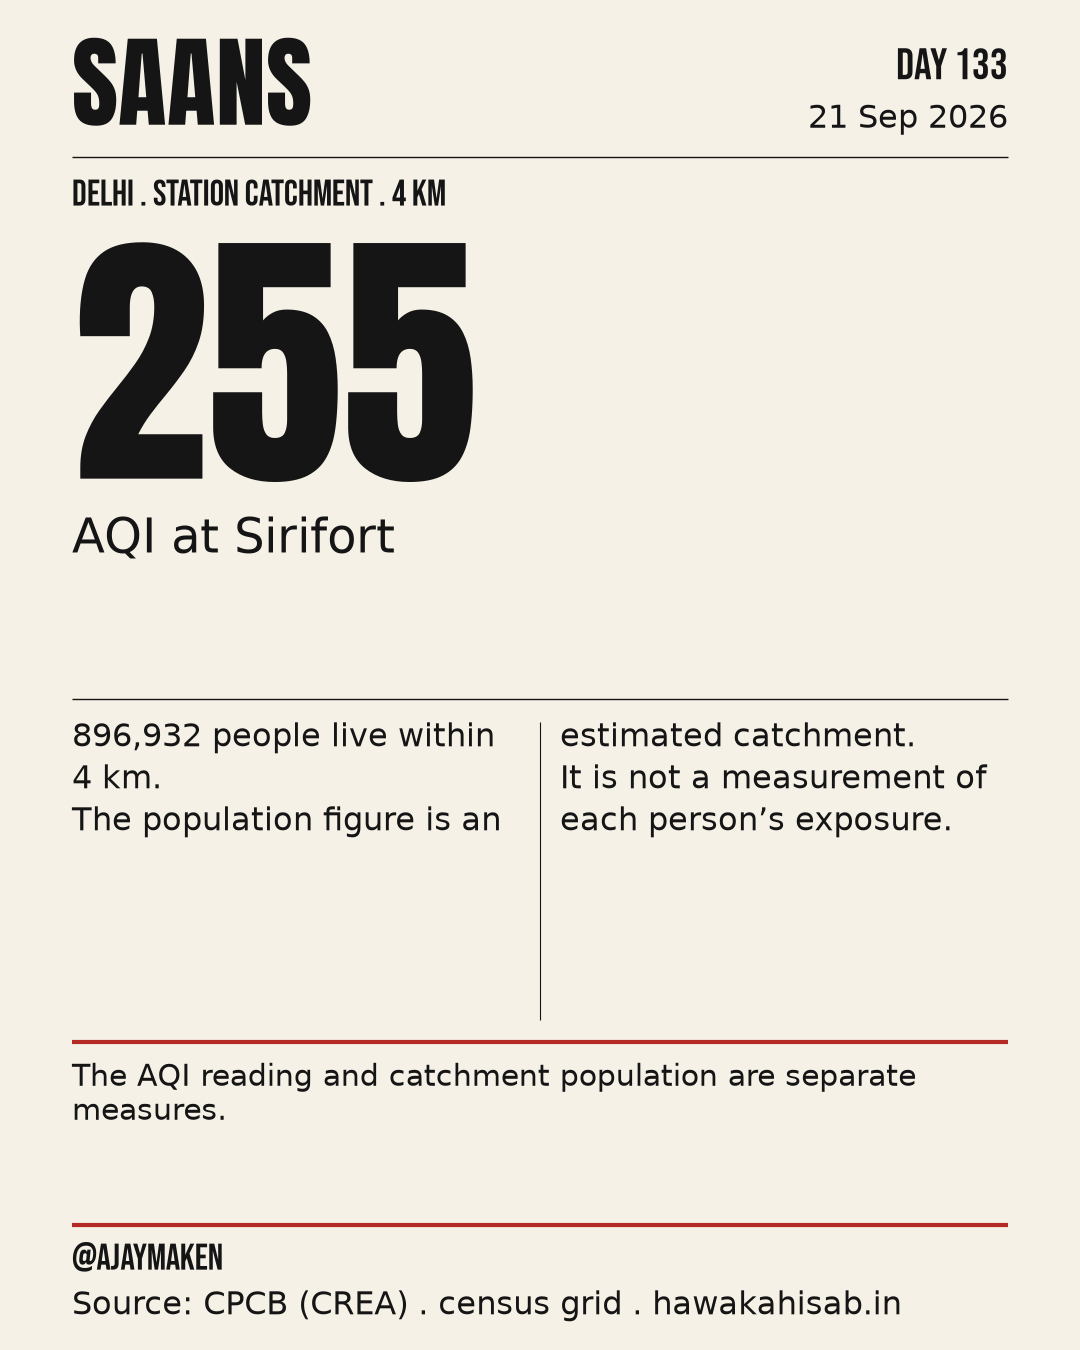
That is 19.7 per cent of Delhi, living around the 5 monitors that read Poor or worse. Sirifort was worst at 255, and 896,932 people live within 4 km of it. On the wider count, 86 per cent live within 4 km of a monitor at Moderate or worse.