मुख्य जाँच
When the monitors stopped giving PM2.5 and PM10 values
At 1 AM on 9 November 2026, 36 of the 59 stations in CPCB's hourly data for Delhi had no PM2.5 reading, and 23 had one. Counted on each night's own list of stations, that was the fewest with a reading in any hour from 8 PM to 7 AM across the 36 nights from 4 October 2026 to Diwali.
Read the hour-by-hour record, the Supreme Court's orders and the source files (English)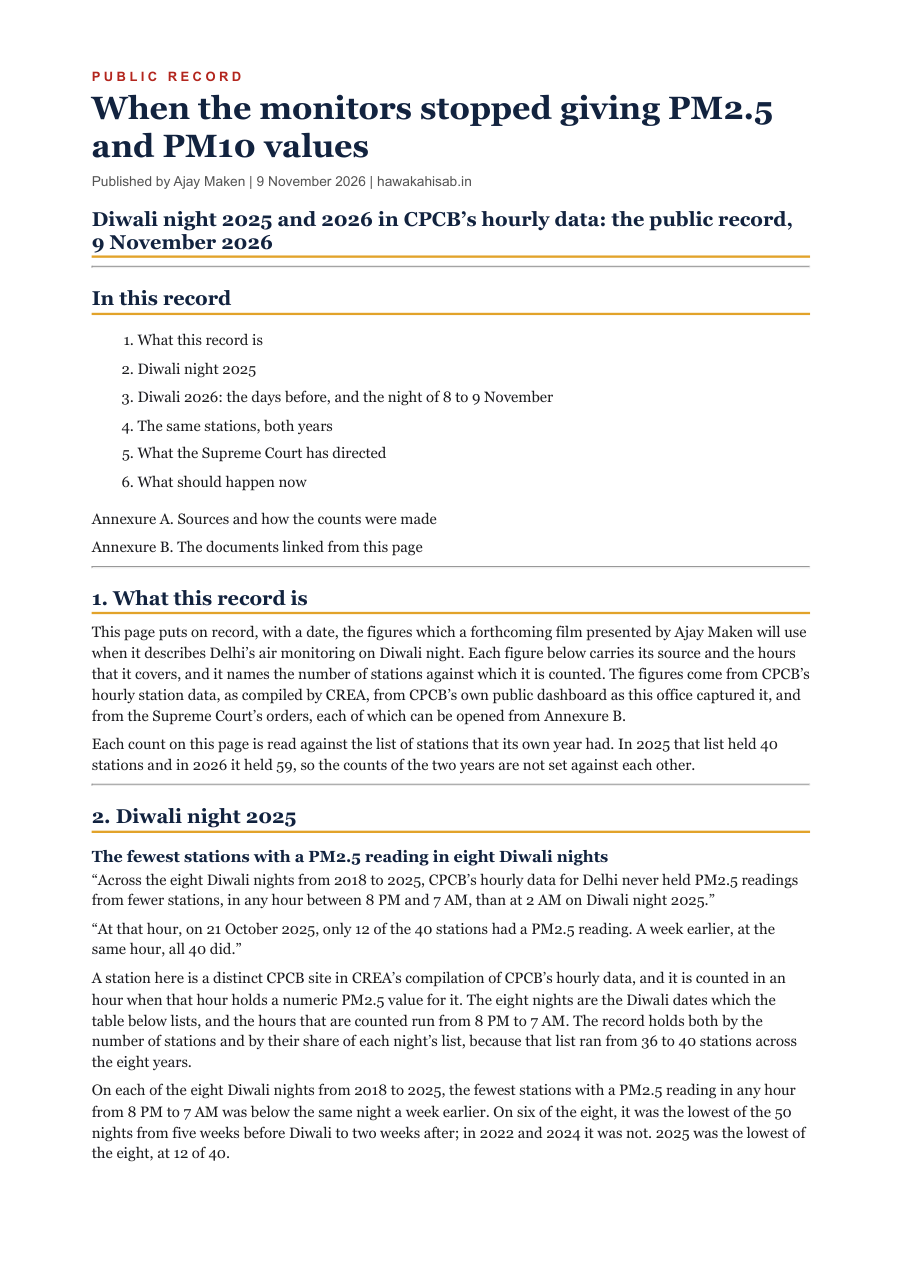
विशेष जाँच
13 new monitors lowered Delhi's AQI on all 26 days, by 11.6 points on average
Thirteen monitors added in October lowered Delhi's 4 PM AQI by 11.6 points on average from 13 October to 7 November 2026.
जाँच पढ़िए (English)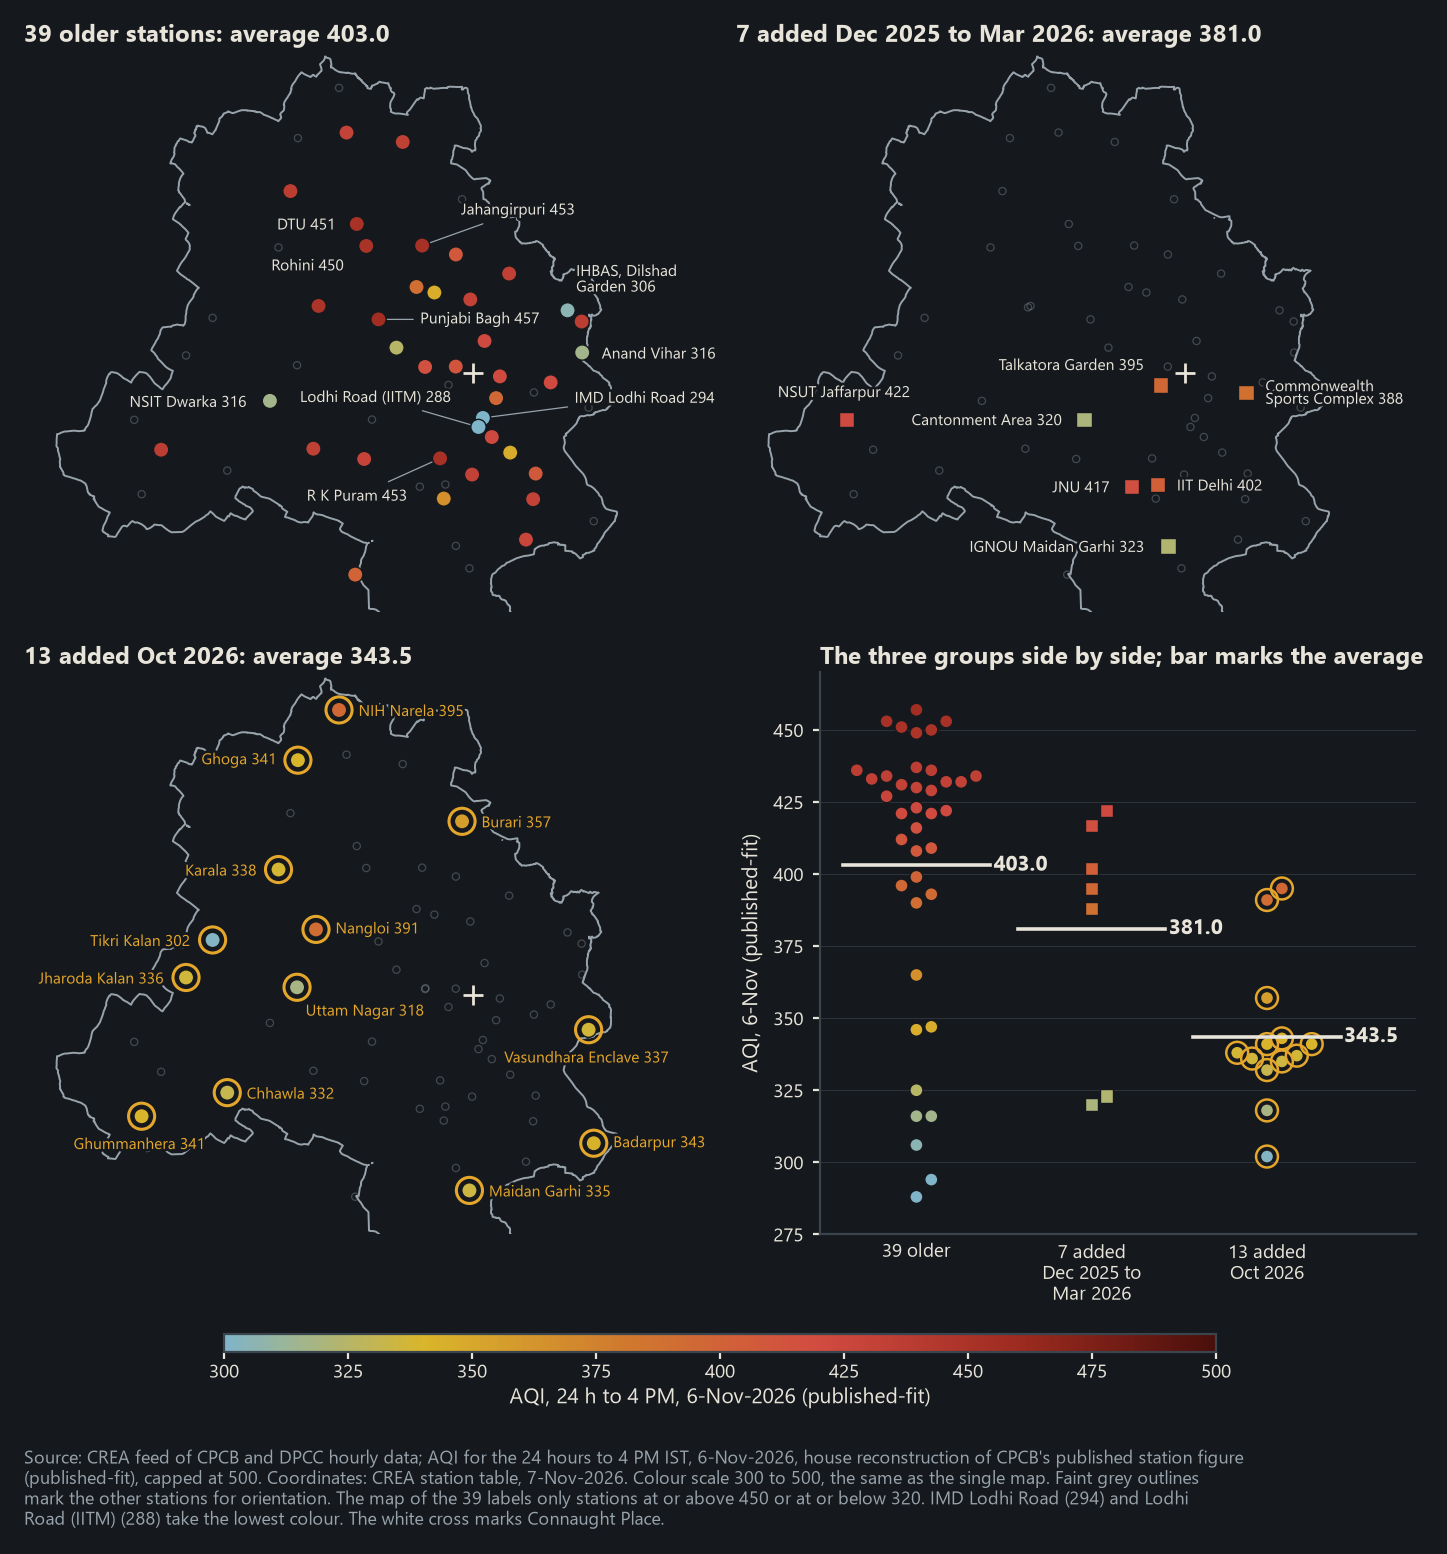
CAQM के दावे के उलट, CPCB के अपने आँकड़ों में दिल्ली की हवा 2026 में बिगड़ी।
CPCB के दैनिक बुलेटिन के अनुसार जनवरी से सितंबर का दिल्ली का औसत AQI 2025 में 164.3 था, जो 2026 में बढ़कर 167.6 हो गया।
CAQM के दावों का सच
30 सितंबर की विज्ञप्ति का हर दावा CPCB के आँकड़ों के सामने: इस साल औसत AQI 167.6 रहा।
CAQM सदस्यों को पत्र
श्री अजय माकन का अनुरोध: CAQM के दो ग़ैर-सरकारी सदस्य जनवरी से अगस्त 2026 के आँकड़े जारी करवाएँ।
11 पन्नों की पूरी रिपोर्ट
दोनों साल चालू रहे 38 स्टेशनों पर इस साल PM2.5 69.2 से बढ़कर 70.7 µg/m³ हुआ।
एक पन्ने का सार
दोनों साल के 39 स्टेशनों पर अकेले PM2.5 ने AQI को 719 स्टेशन-घंटे 500 की आख़िरी हद पर रखा, 2025 में 221।
फ़िल्में देखें: 2026 में दिल्ली की हवा और बिगड़ी
दिल्ली की बिगड़ी हवा, हिंदी में
28 सितंबर तक 39 स्टेशनों पर अकेले PM2.5 से AQI 719 स्टेशन-घंटे 500 पर रहा, 2025 में 221।
दिल्ली की बिगड़ी हवा, अंग्रेज़ी में
CAQM ने नौ महीनों का औसत AQI छोड़ दिया, जो CPCB के अनुसार 164.3 से बढ़कर 167.6 हुआ।
ताज़ा रिपोर्ट · 14 November 2026
500 AQI at IIT Delhi, 24 hours to 4 PM, 14 November 2026, the worst monitor in Delhi today, Severe on CPCB's documented formula, and PM10 set that figure. 7.2 lakh people live within 4 km of it.
यह रिपोर्ट अंग्रेज़ी में है।
ताज़ा रिपोर्ट
पूरी रिपोर्ट
इस दिन की पूरी लिखित रिपोर्ट, हर आँकड़े और उसके स्रोत के साथ।
पढ़ें
संग्रह
हर उस दिन की रिपोर्ट, जिस दिन इतने स्टेशनों से आँकड़े आए कि ईमानदारी से रिपोर्ट छापी जा सके।
पूरा संग्रह देखें
फ़िल्में
हर दिन हिंदी में एक छोटी फ़िल्म, जो उसी विश्लेषण से बनती है जिससे उस दिन की लिखित रिपोर्ट बनती है।
फ़िल्में देखें
पड़ताल
रोज़ के रिकॉर्ड से आगे जाकर की गई स्वतंत्र पड़ताल।
पड़ताल देखें
तरीक़ा
हर एक्यूआई आँकड़ा CPCB के अपने प्रकाशित फ़ॉर्मूले से कैसे निकाला जाता है, और हर संख्या कहाँ से आती है।
तरीक़ा जानें
प्रकाशक
प्रकाशक श्री अजय माकन, संसद सदस्य, राज्यसभा। आधार CPCB के सरकारी आँकड़े। विश्लेषण और उसमें हुई कोई भी ग़लती हमारी है।
परिचय और संपर्कदिल्ली की हवा की तबाही
1980 to July 2026: 46 full calendar years, followed by a partial year
सरकार के अपने मॉनिटरों पर 2025 में यह शहर 97.0 माइक्रोग्राम प्रति घन मीटर सांस ले रहा था, जो विश्व स्वास्थ्य संगठन की सीमा से लगभग 19.4 गुना है, और 2026 में समाप्त हुए जाड़े का औसत 200.5 था।
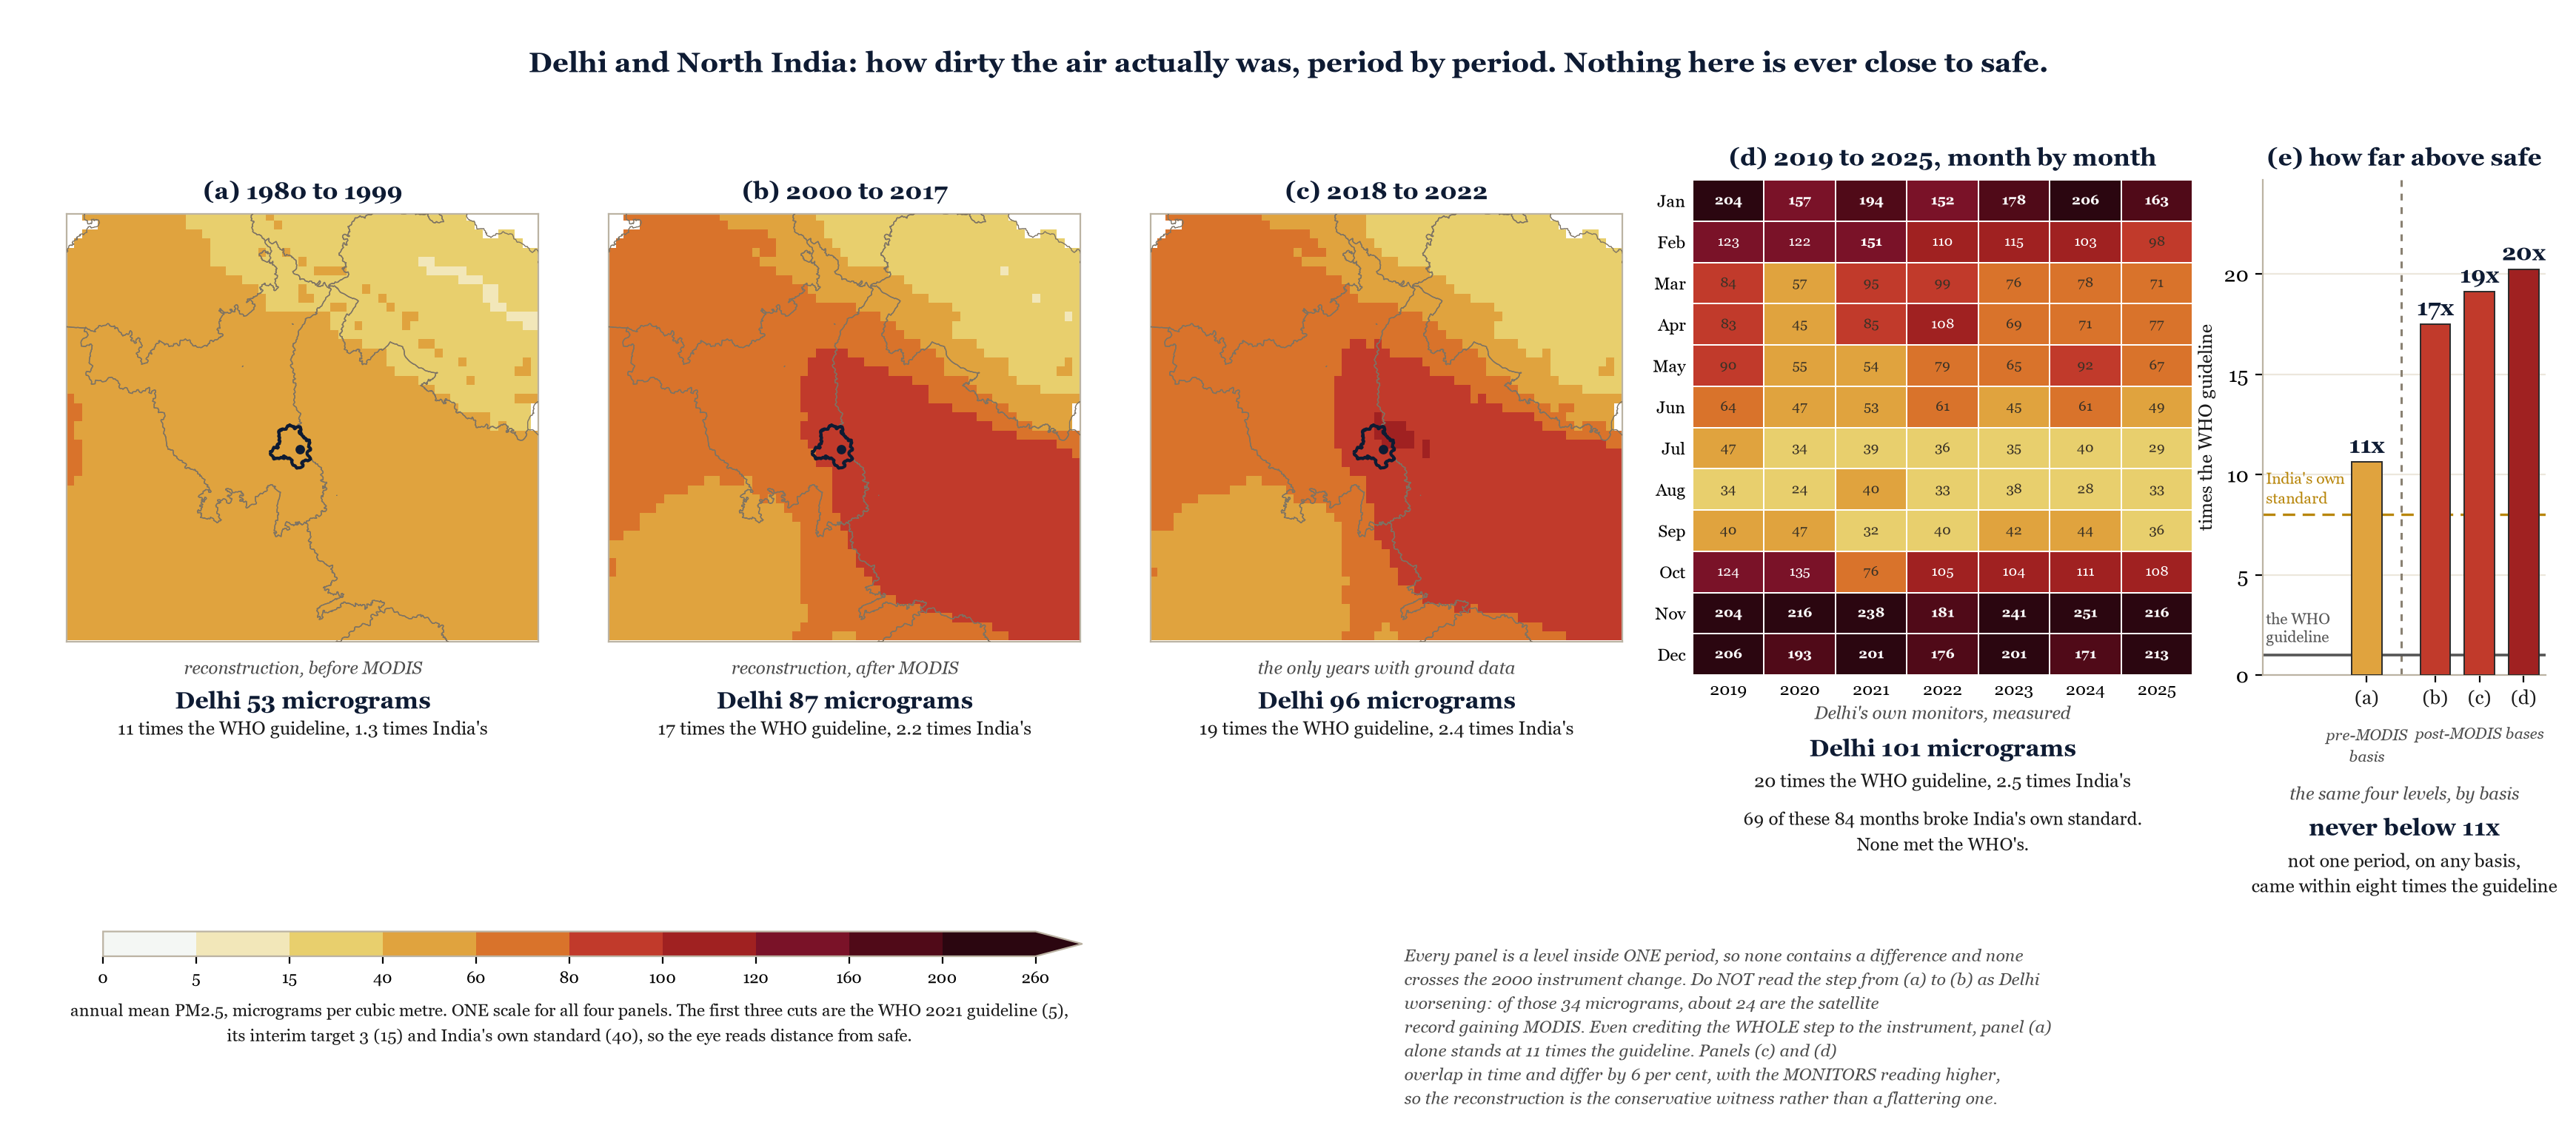
Fixed-panel Delhi annual PM2.5 in 2024 and 2025, in micrograms per cubic metre. The lines mark India's annual reference of 40 and the WHO annual guideline of 5. Source: CPCB and DPCC monitors via CREA. The historical study ends on 31 July 2026.
आभार
विशेष आभार: Centre for Research on Energy and Clean Air (CREA)। इस विश्लेषण का आधार वही घंटेवार संकलन है जो CREA तैयार करता है, और हवा को लेकर जन जागरूकता बढ़ाने में उसका अपना योगदान बड़ा है। इस साइट में CREA की कोई भागीदारी नहीं है, और इसके विश्लेषण या निष्कर्षों की ज़िम्मेदारी उस पर नहीं है।