Published by Mr. Ajay Maken, Member of Parliament, Rajya Sabha. Independent analysis of official CPCB monitoring data. Data compiled by CREA, with our thanks for its work in creating awareness. CREA has no involvement in this site. Contact: [email protected]

Today · 16 September 2026

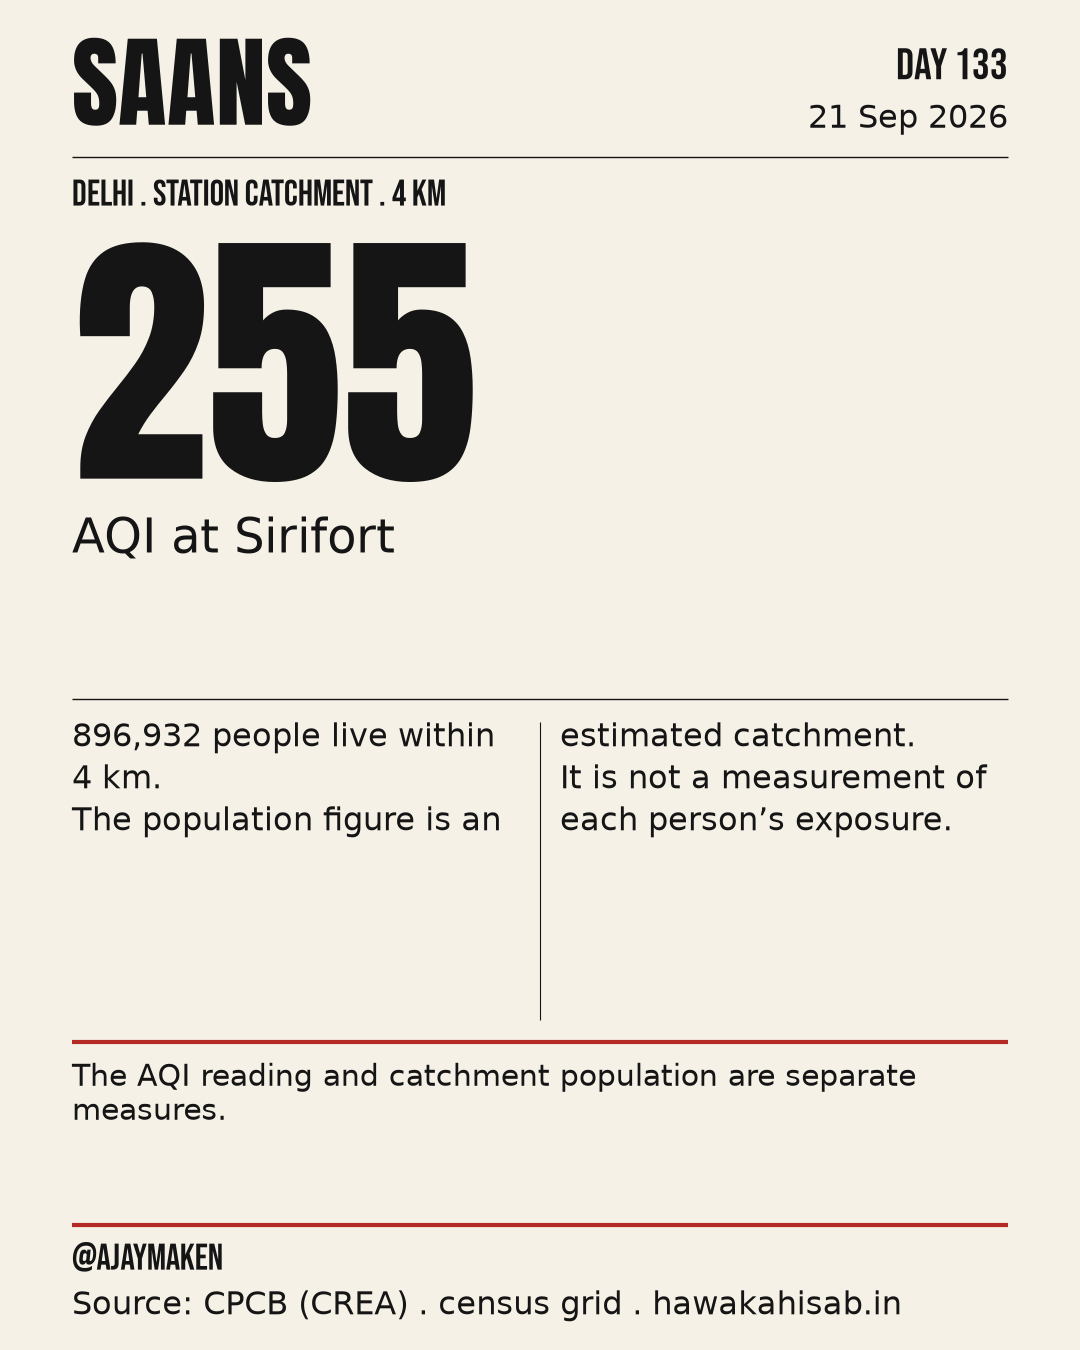
184 AQI at Pusa, the worst monitor in Delhi today, Moderate on the Central Pollution Control Board's own scale, and ozone set that figure. 12.3 lakh people live within 4 km of it.

184
AQI at the worst station
Pusa

Today in cards

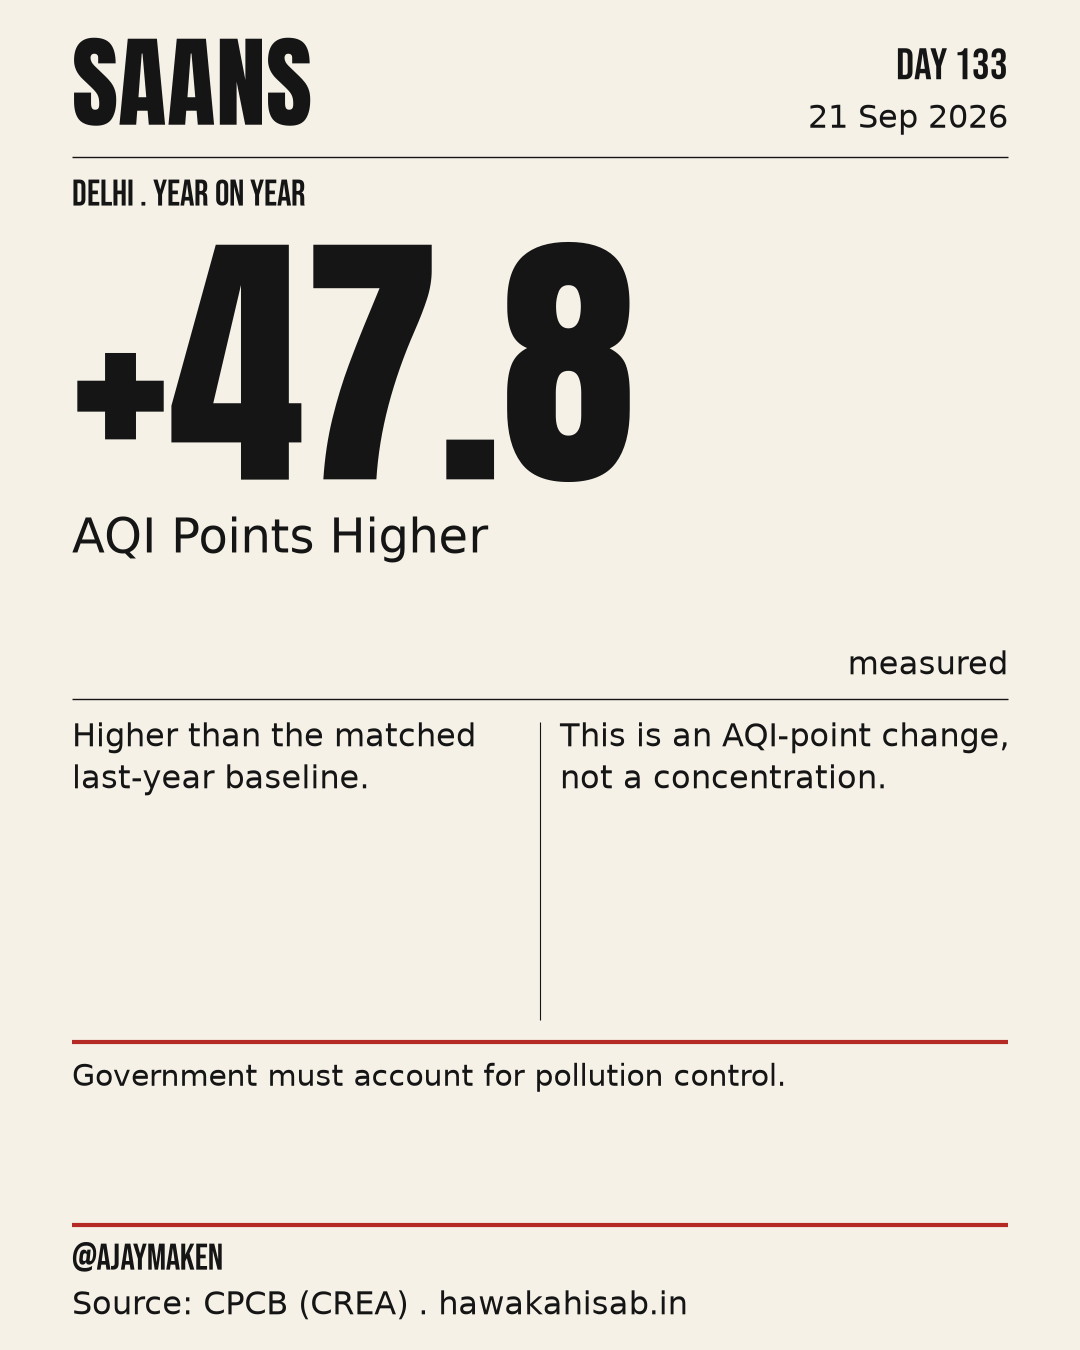
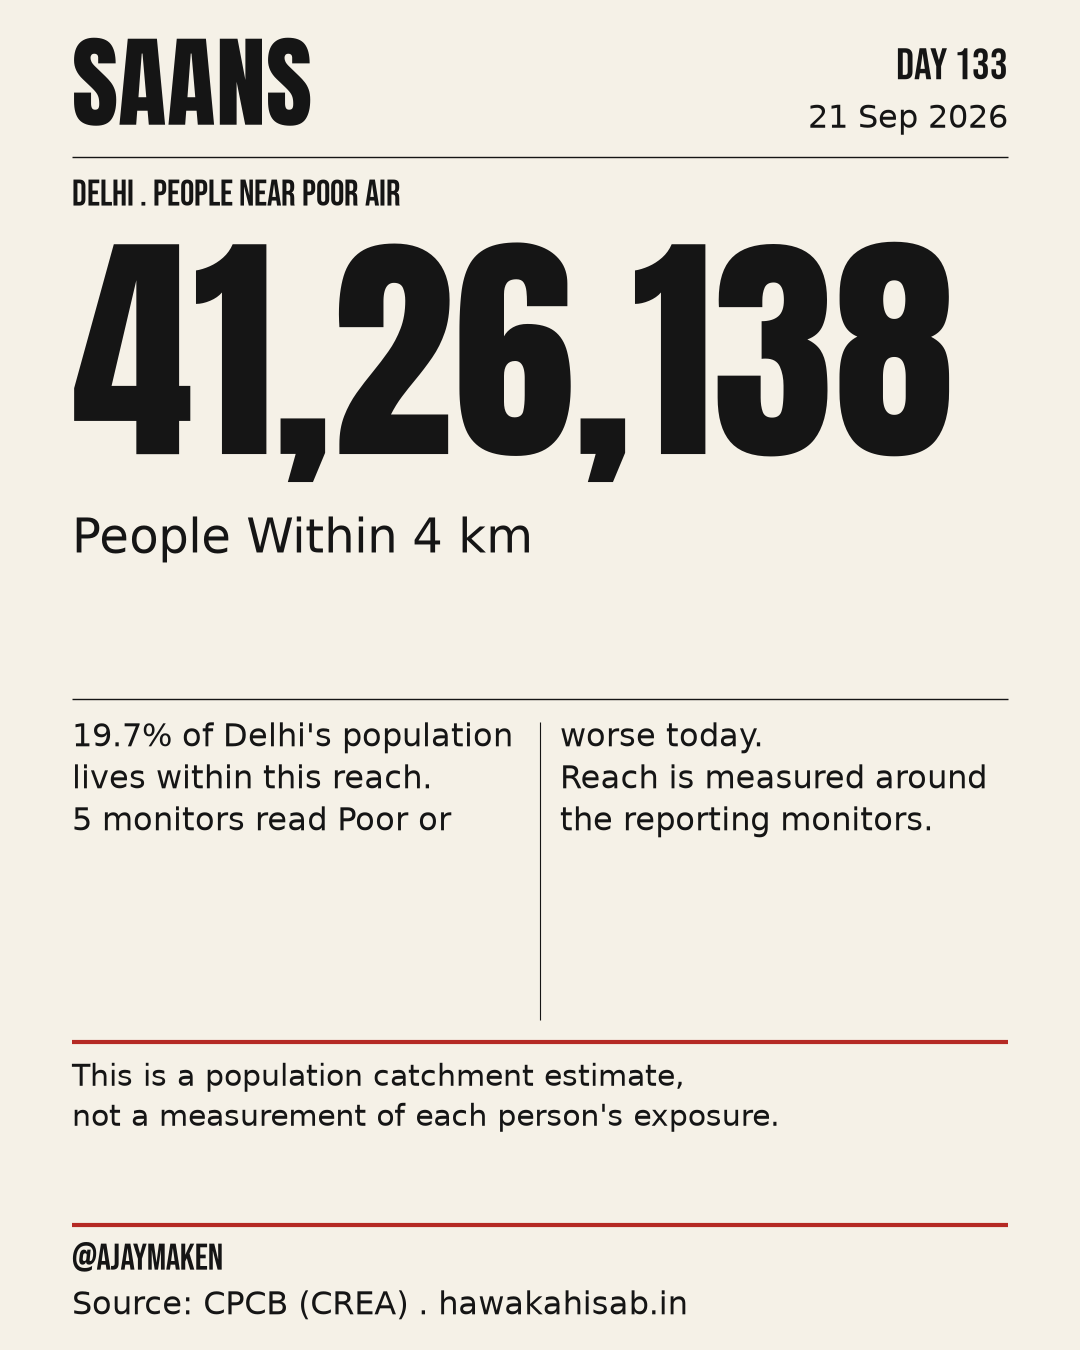
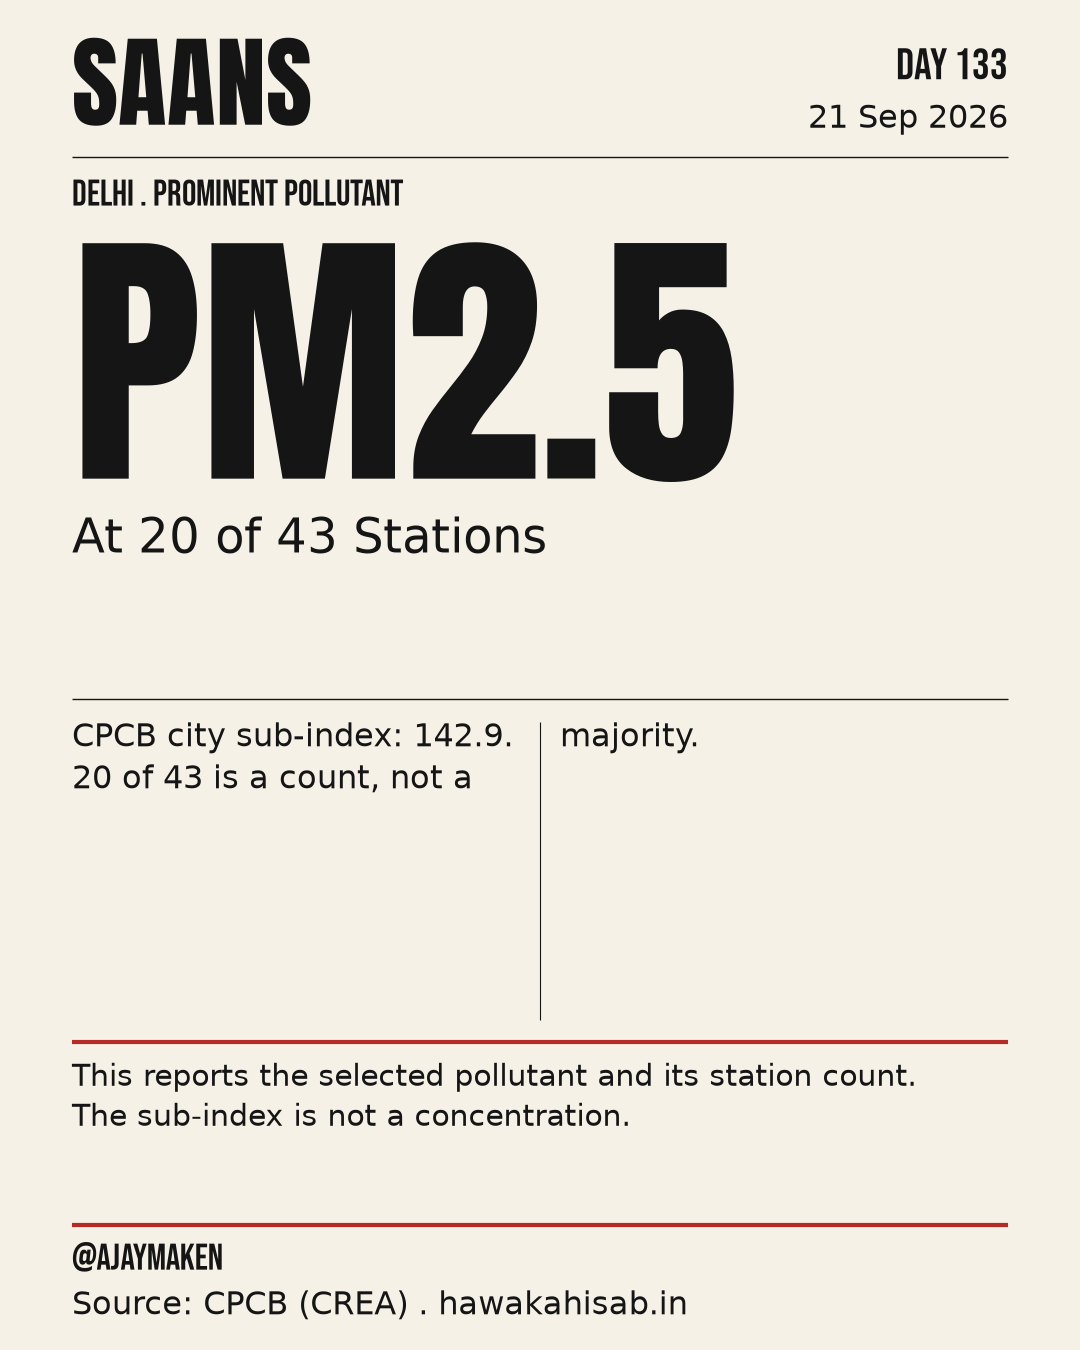
Health warning (AQLI)Pusa AQI 184; 1234858 people within 4 km13 stations worse than last year; Pusa +8241/43 stations over WHO on PM2.5, 43/43 on PM1028.3% of monitors above AQI 200 on an average day this year, 27.8% last year

The same cards that went out on Instagram, Facebook, X and WhatsApp today. Tap one to open it full size.

Analysis window: 10 AM 15th September to 10 AM 16th September
Baseline: YoY baseline: avg of 9th Sep - 23rd Sep 2025 (same +/-7 days), matched stations
A caution we publish daily: Gas data carries documented unit-inconsistency (peer-reviewed international research, 2025); we lead on the reliable PM2.5/PM10.
The long record

The destruction of Delhi's air

Forty-seven years of evidence, 1980 to July 2026

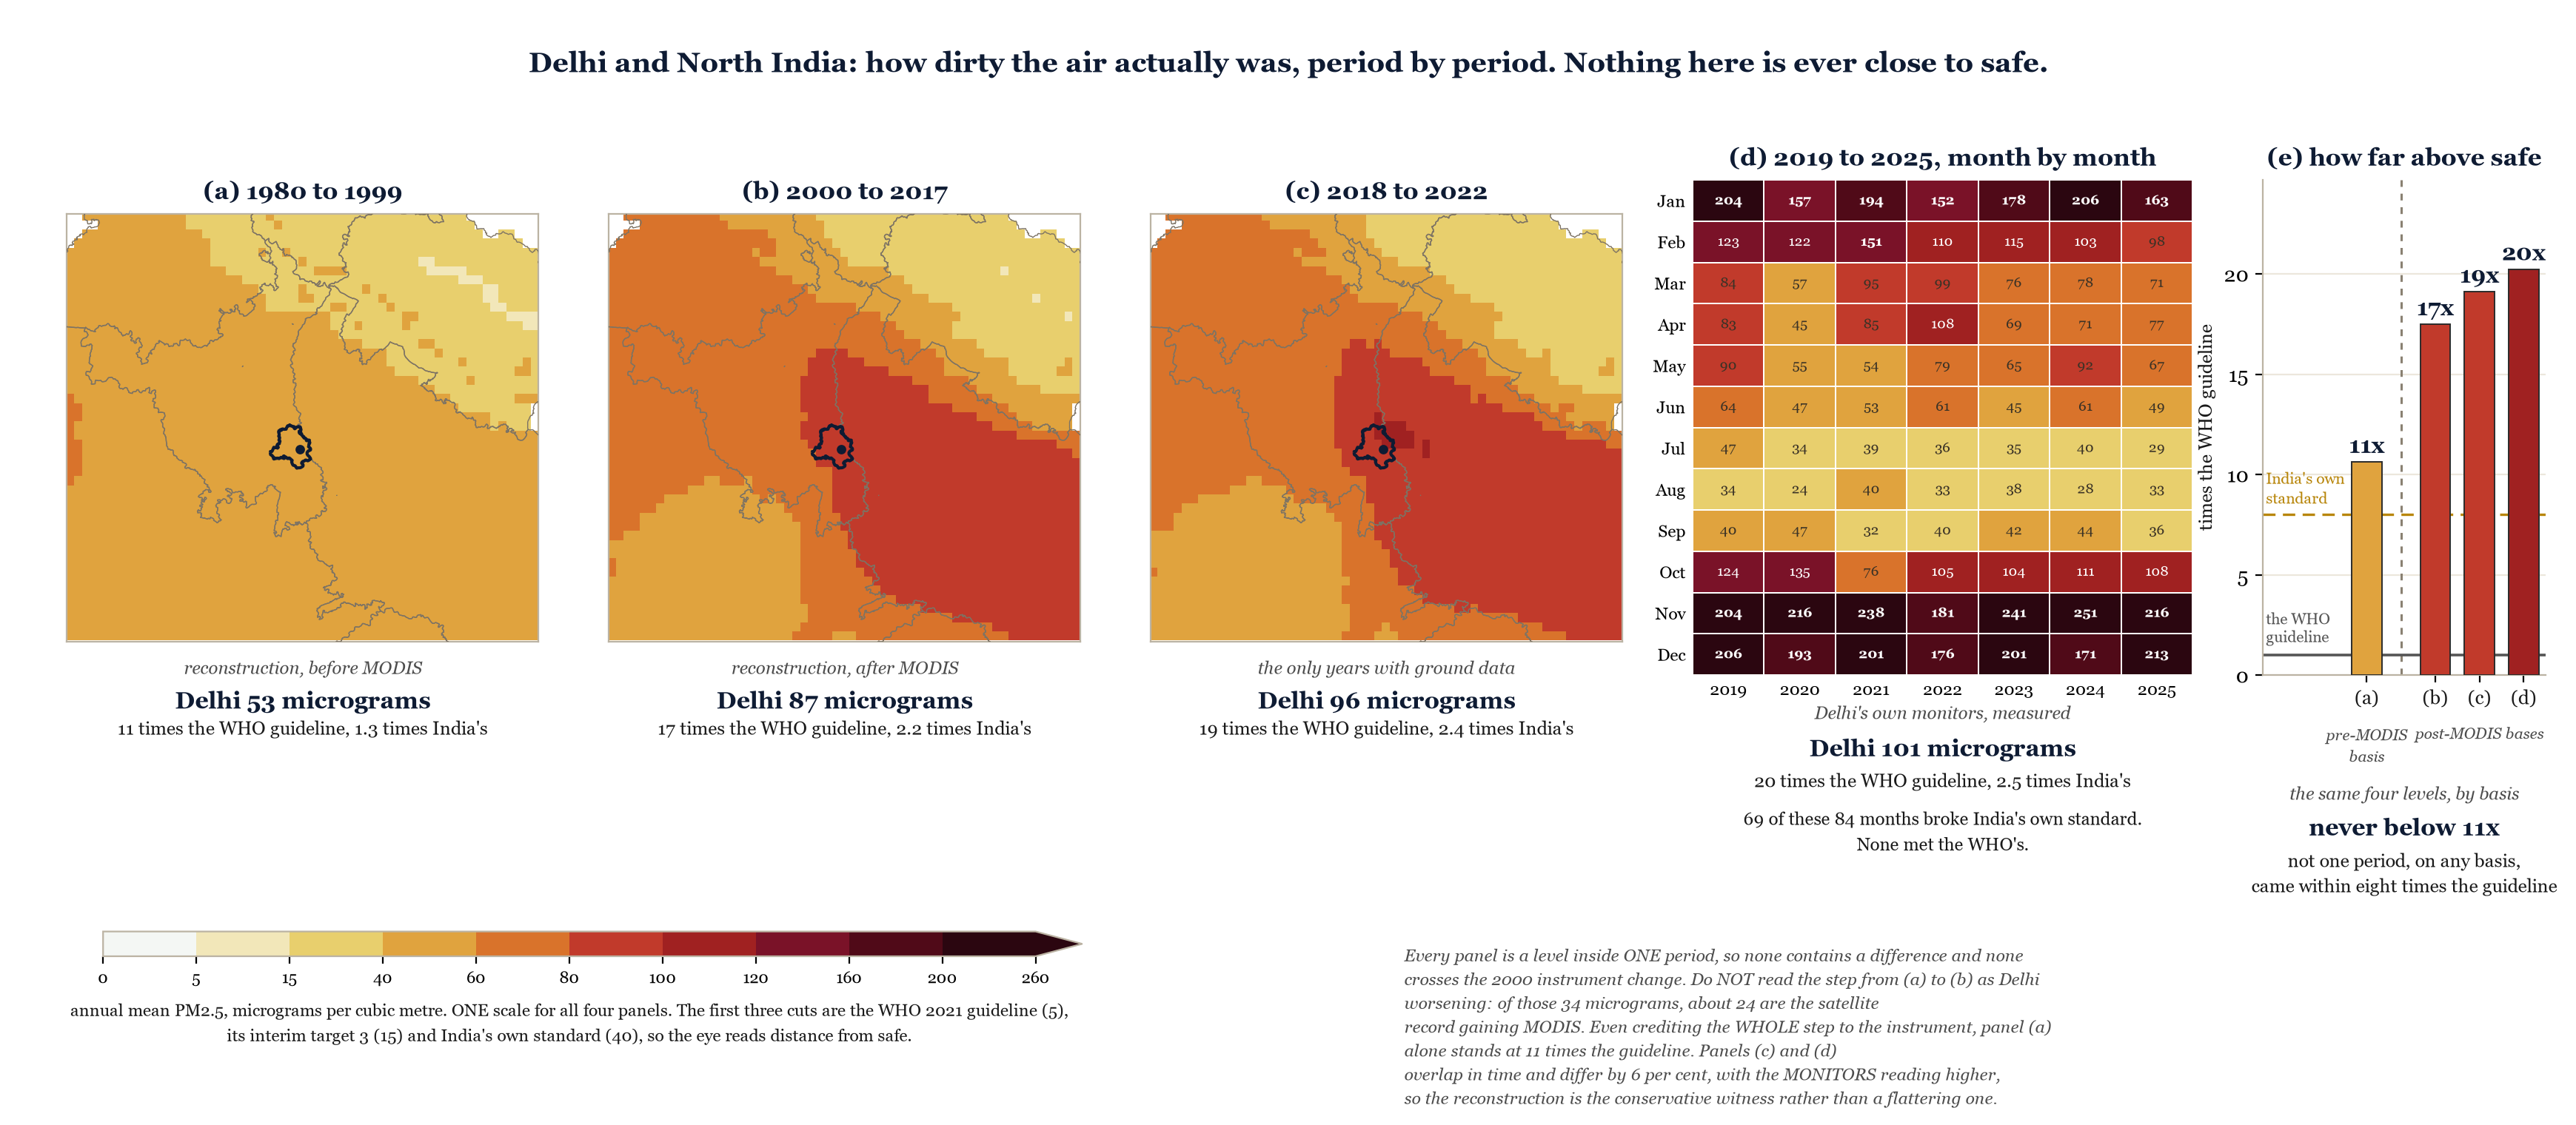
Delhi has never once met India's own annual standard for clean air, in any of the forty-seven years this record covers. On the government's own monitors the city breathed 104 micrograms in 2024, which is about 21 times the World Health Organization's guideline, and the winter that ended in 2026 averaged 200. Delhi had no working network of monitors until the 2010s, so the years in which its air was ruined were never measured at the time, and this report reconstructs them.

Annual mean PM2.5 across North India, one panel per period, with Delhi outlined in each. Every panel is a level inside a single period, so none contains a comparison and none crosses the instrument change of 2000. The last panel is Delhi's own monitors, measured, and the fifth restates the four levels as multiples of the WHO guideline.

Annual mean PM2.5 across North India, one panel per period, with Delhi outlined in each. Every panel is a level inside a single period, so none contains a comparison and none crosses the instrument change of 2000. The last panel is Delhi's own monitors, measured, and the fifth restates the four levels as multiples of the WHO guideline.

Today

Today's full report

Roughly twelve pages: the verdict on today's air, every monitoring station, the weather versus policy attribution, the full year of de-weathered trends, and the annexures behind each number.

Read

The archive

The run

One report for every day the monitoring network reported enough stations to publish honestly.

See the daily archive

The films

The beam

A short film every day, narrated in Hindi, built from the same analysis as that day's written report.

Watch the films

The deep edition

The lid

A longer reckoning each week: the seven days together, what moved, and what the movement was actually caused by.

Read the weekly

Investigations

The evidence

Standalone investigations that go beyond the daily record.

See the investigations

The method

Taking the weather out

How we separate the pollution the city produced from the weather it happened to get, and why that is the only honest comparison.

How it works

Who publishes this

At street level

Published by Ajay Maken, Member of Parliament, on official CPCB monitoring data. The analysis, and any error in it, is ours.

About and contact

With thanks

With special thanks to the Centre for Research on Energy and Clean Air (CREA). Its hourly compilation of the official station data is what this analysis is built on, and its own work has done a great deal to create public awareness of the air. CREA has no involvement in this site and bears no responsibility for its analysis or conclusions.